Blog
Read more about current weather topics, use cases, and the functionality of Visual Crossing Weather in our many articles.

Loading Weather into your Datastores
Power Up Your Data Warehouse with Weather Data: The Visual Crossing Affordable Advantage In today's data-hungry world, companies are constantly…Visual Crossing / February 20, 2026
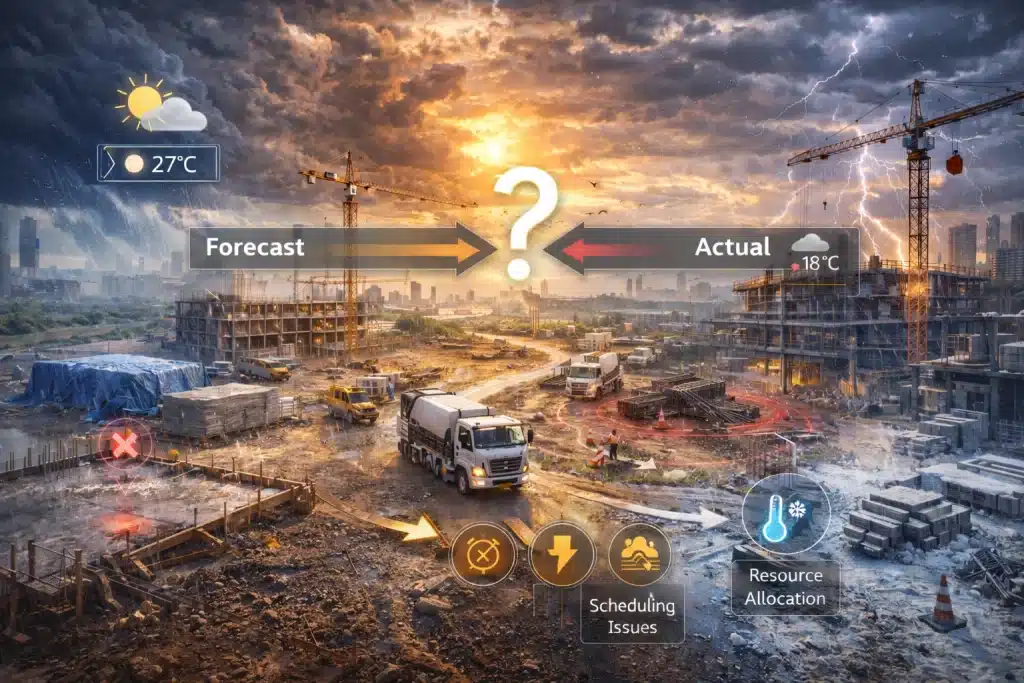
Why Weather Uncertainty Causes Costly Construction Delays
Weather uncertainty is the gap between forecast weather conditions and actual on-the-ground conditions. While this may be a minor inconvenience…Visual Crossing / February 19, 2026

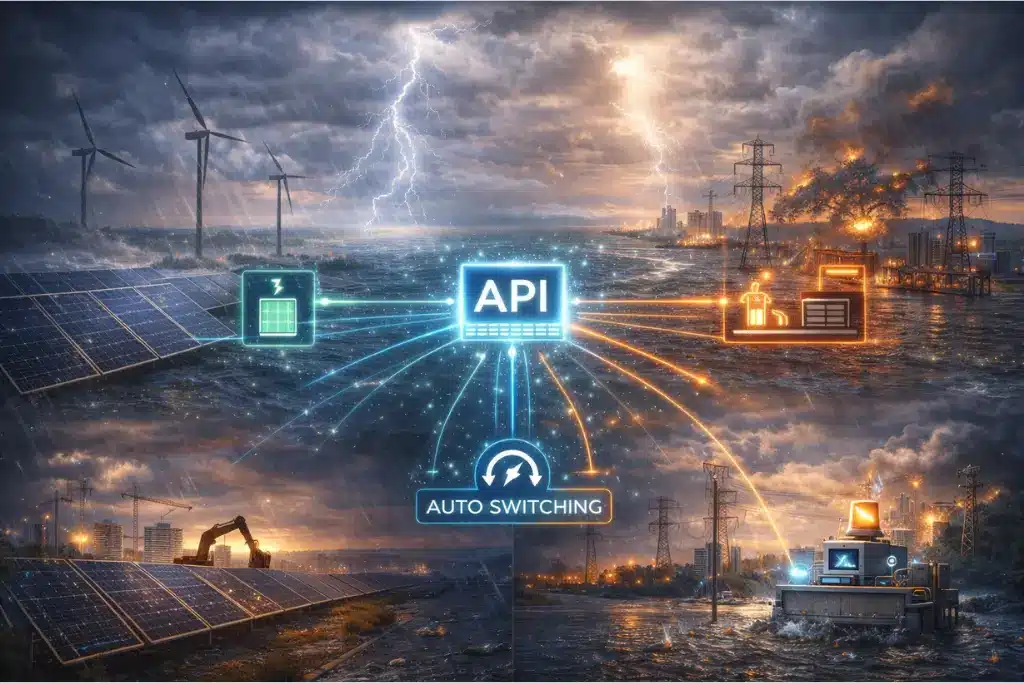
Real-Time Forecasting for Renewable Energy Efficiency and Grid Optimization
Renewable energy infrastructure is highly weather-dependent. Even small shifts in wind speed or solar irradiance can influence energy yield and…Visual Crossing / February 6, 2026
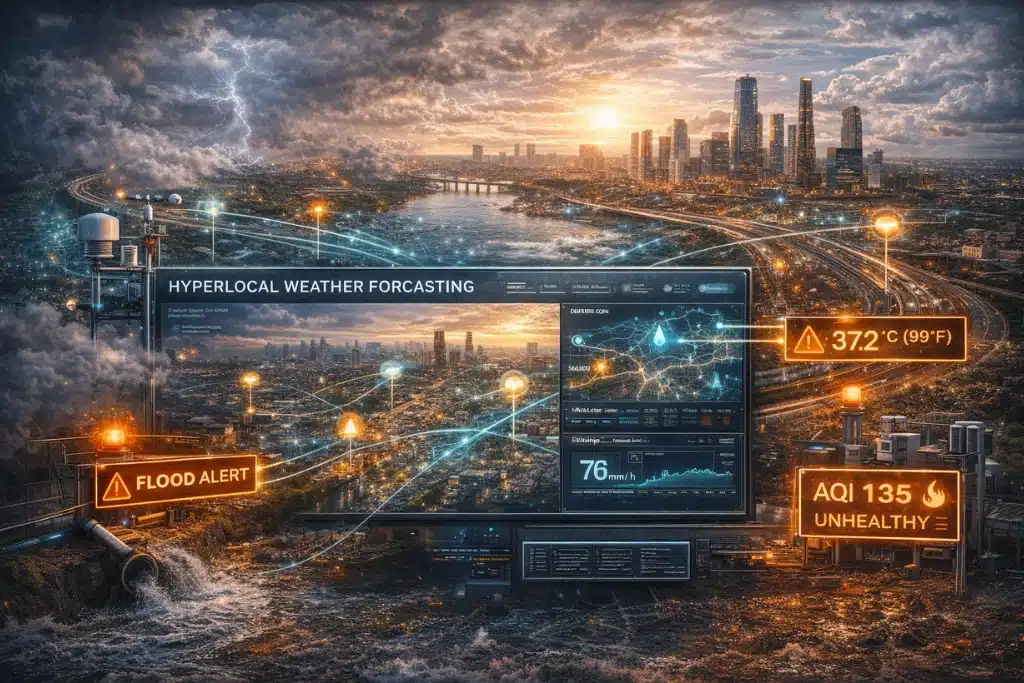
Hyperlocal Forecast APIs: Bridging the Gap Between Global Models and Local Reality
Standard forecasts use regional or global weather data that only provide general estimates for local conditions. While these can be…Visual Crossing / February 6, 2026
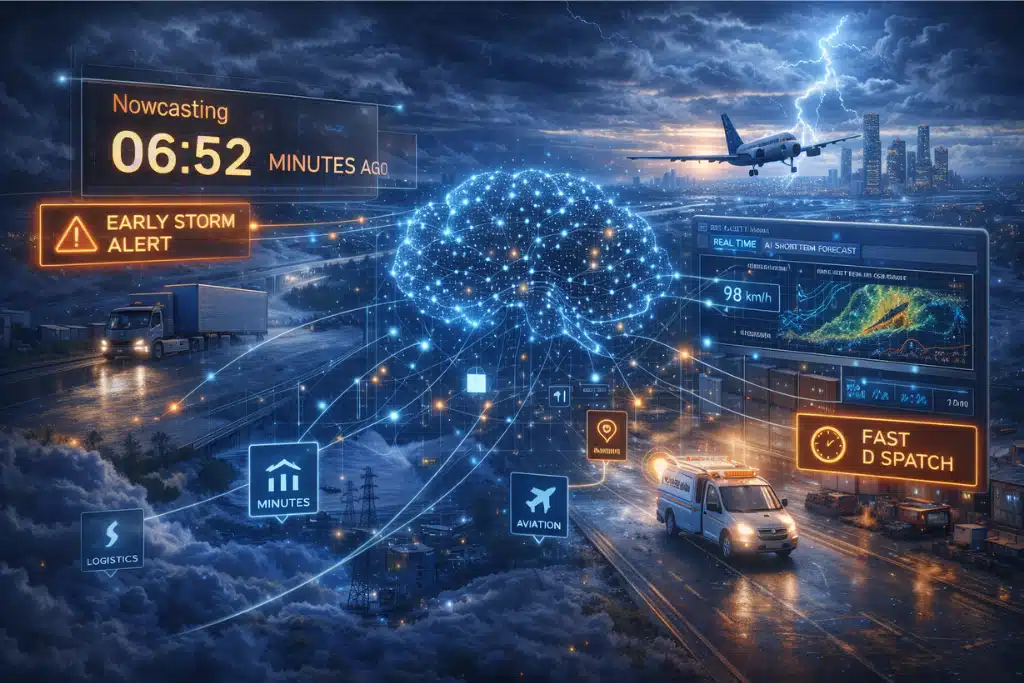
AI-Powered Weather Forecasting: How Machine Learning Is Transforming Accuracy and Speed
Business decisions often depend on accurate weather forecasts, especially during extreme weather events or seasonal shifts. Artificial Intelligence (AI) models…Visual Crossing / February 6, 2026
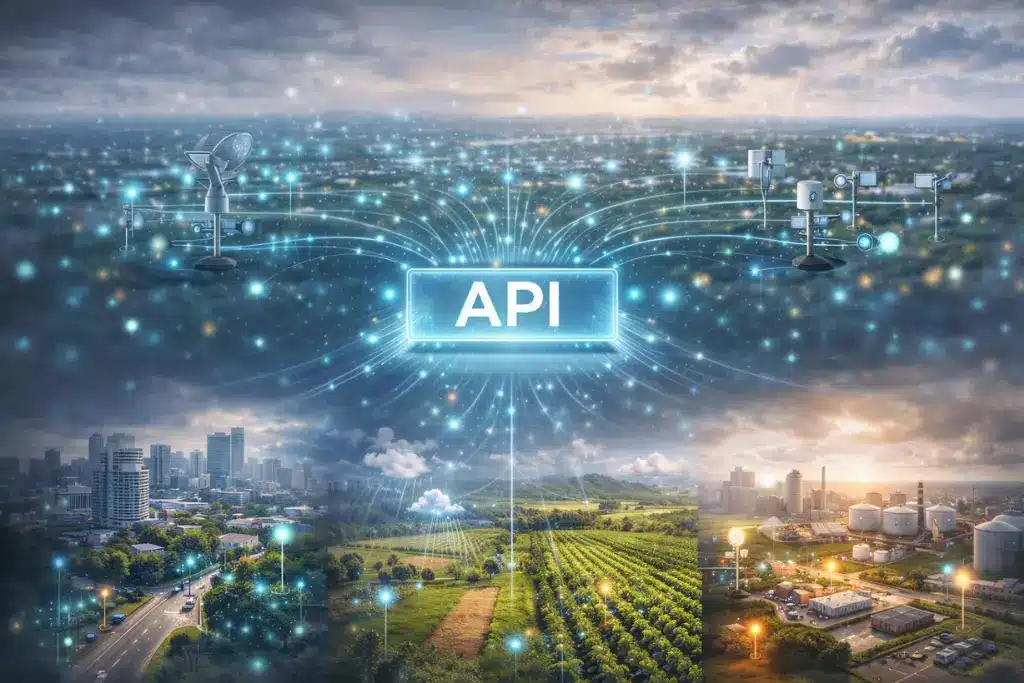
Real-Time Weather APIs: Delivering Live Environmental Insights for Businesses
Modern operations depend on instant, accurate weather data to protect their assets and make smart business decisions. Daily forecasts don't…Visual Crossing / December 31, 2025
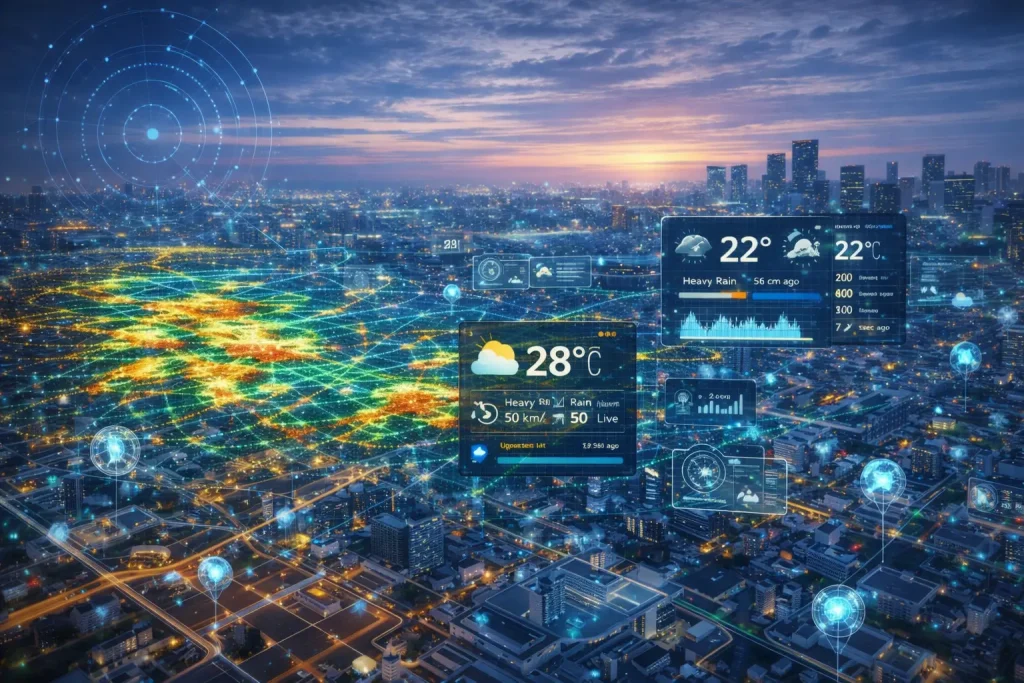
Hyperlocal Forecasting for Smarter Urban Planning and Climate Adaptation
Hyperlocal weather forecasts are essential for building safe, resilient cities, as urban environments face highly localized risks and street-level microclimates.…Visual Crossing / December 31, 2025
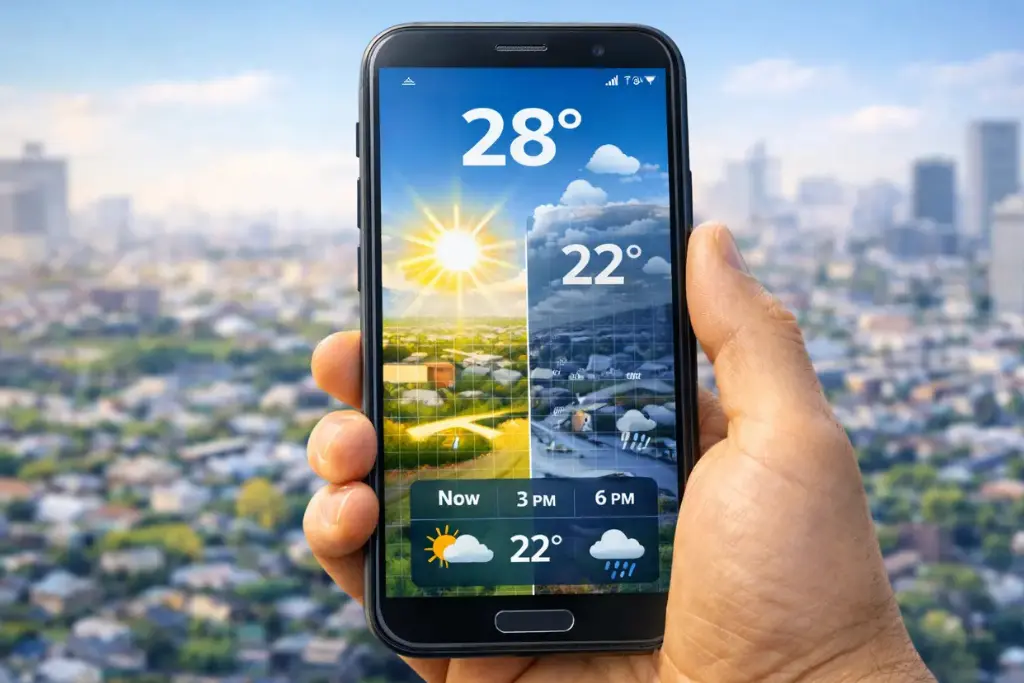
Real-Time Weather Forecasting: Powering Instant Decisions Across Industries
High-pressure industries cannot rely solely on hourly or multi-hour forecasts, as conditions shift quickly and require immediate intervention. As such,…Visual Crossing / December 25, 2025

AI Forecasting Models vs Traditional Weather Prediction: Understanding the Evolution of Forecast Accuracy
Traditional forecasting uses numerical weather prediction, which is based on physics equations and run on supercomputers. In contrast, Artificial Intelligence…Visual Crossing / December 25, 2025

Hyperlocal Weather Forecasts: Why Location Precision Matters More Than Ever
Weather conditions can differ widely across an area, meaning that crucial site-specific information may not appear on generic forecasts. As…Visual Crossing / December 25, 2025
The Future of Weather Forecasting: Combining Real-Time and Hyperlocal Intelligence
The future of weather forecast models is faster, more precise, hyperlocal data that leverages artificial intelligence for real-time insights. Internet…Visual Crossing / December 25, 2025
Travel Weather Planning: Enhancing Destination Choices, Activities, and Guest Experience in Hospitality
Travel weather planning is a key element of boosting revenue and guest satisfaction in the tourism and hospitality industries. By…Visual Crossing / December 5, 2025