

Hurricane Ida intensified late in August and made landfall west of New Orleans as a category 4 hurricane with sustained winds of 150mph. With it brought a tremendous amount of damaging winds and rain. Over the next few days it went through the middle of the United States from Louisiana, Mississippi, and all the way through to Pennsylvania, New Jersey and New York as well as affecting weather patterns in all adjacent states. Massive amounts of rain fell creating destructive flood conditions on most of its path. We are going to examine what the exact rain totals were and how it happened. We are also going to see if the scientific readings match up to the media reports. The destruction of this storm is evident but we want to examine the actual totals of this weather event.
From news reports on the 29th of August, reports of 17″ of rain around New Orleans were broadcast on networks. It was the 5th worst hurricane in recorded US History. However, if you query observational data from NOAA weather stations you will see rain totals that don’t match the media reports. We will examine why this is.
Lets first look at minute 0:38 of an CNBC report that basically said that 17″ of rain fell in a location just west of New Orleans:
Where did this information come from? Is this all media hype to get more attention? Or was there an actual source for this that went unmentioned. Let’s see if we can take a look at three sources of information and try to confirm: Station Observational Data (www.visualcrossing.com), Mesonet data using personal stations and finally Radar from the national weather service.
Observational Station Data
Observational data is collected the old fashioned way through instruments located at managed weather stations such as airports. These stations are scattered throughout the world in various densities depending upon population. They are highly accurate but do present scenarios where micro geographic events can be unreported. The news report mentioned that the rainfall of 17″ occurred just west of New Orleans. It just so happens that a major airports (MSY – Louis Armstrong Airport) is just west of New Orleans and has a high quality weather station there that we can report on. To be precise, we entered the exact Station ID (stn:72231012916 ) into our historical weather dashboard and got the following results:
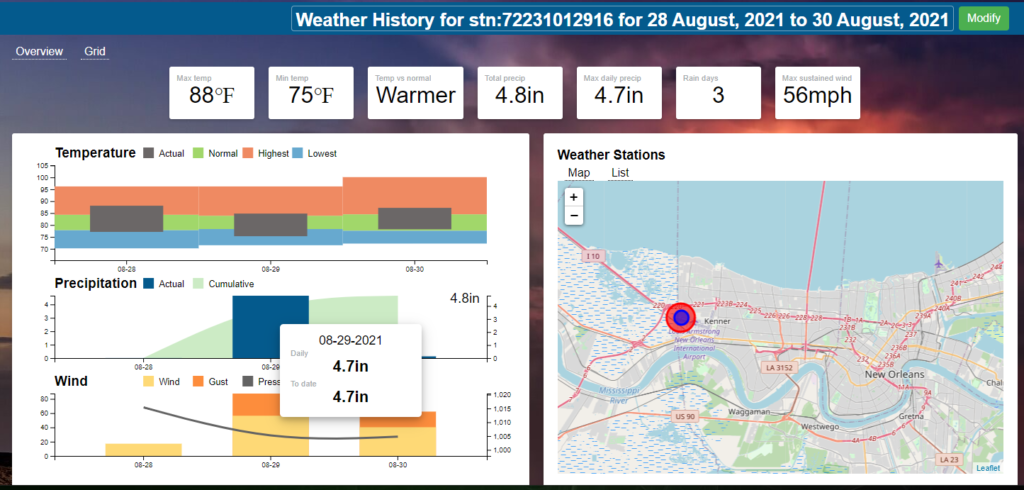
If you wish to follow along with the live analysis you can use the link here:
https://www.visualcrossing.com/weather-history/stn%3A72231012916/us/2021-08-28/2021-08-30
Our report at this one station states that 4.7″ of rain fell on August 29th, 2021 when Ida came ashore. If we let the system include data from surrounding stations we average out the New Orleans area weather to about 5.7″ for that day. When you are not close to a station, the system will use multiple stations to interpolate your specific rain value for a custom geographic point such as an address, city, zip code or lat/long coordinate.
Personal Stations – Mesonet
To best option to display what was registered by personal and community stations is: https://maps.cocorahs.org/ This is the best way to visually look around the area at all personal stations. Please note that some personal stations will show wildly inaccurate values at times and at other times they can be invaluable to show micro-geographic conditions and anomalies not picked up by the major stations. Here is a map around New Orleans for when Ida hit land on the 29th.
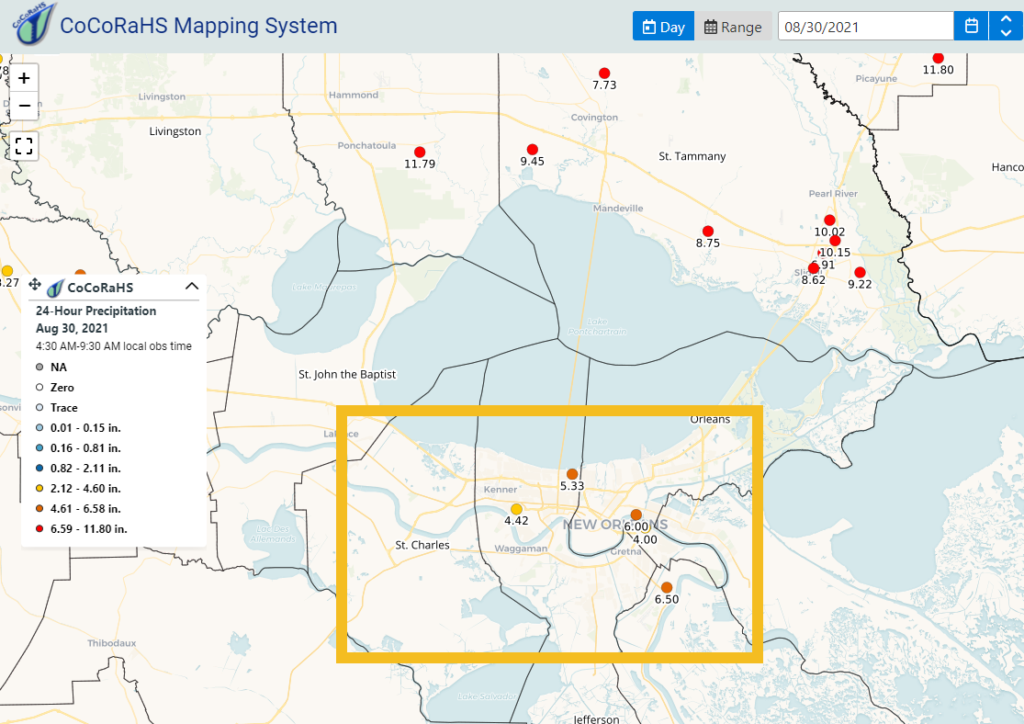
Notice that the reports around the New Orleans and west areas do not report any major rainfalls. We do however see that far north we are getting some large rainfall totals from these stations in the range of 10″, but again nothing near the 17″ media reports.
Also note that we confirmed these values with the standard observational station data using our nearest airport station at Slidell Airport in that same northern area (stn:72233053865) and at most it reports 7.9″ of rainfall.
Radar
Using radar to report rainfall data has had mixed successes and we will refer you to this article from Science Direct to describe its usage and success rates:
https://www.sciencedirect.com/science/article/pii/S2215016115000552
For the actual reporting data on radar data we will use the National Weather Service/NOAA site:
https://water.weather.gov/precip/
Given the differences of radar it can do a good job of showing more granular pockets of rainfall that can go unnoticed by major weather stations. It is possible that it could find the pocket of 17″ rain west of New Orleans. Here is the map of rainfall for Hurricane Ida in New Orleans on that day:
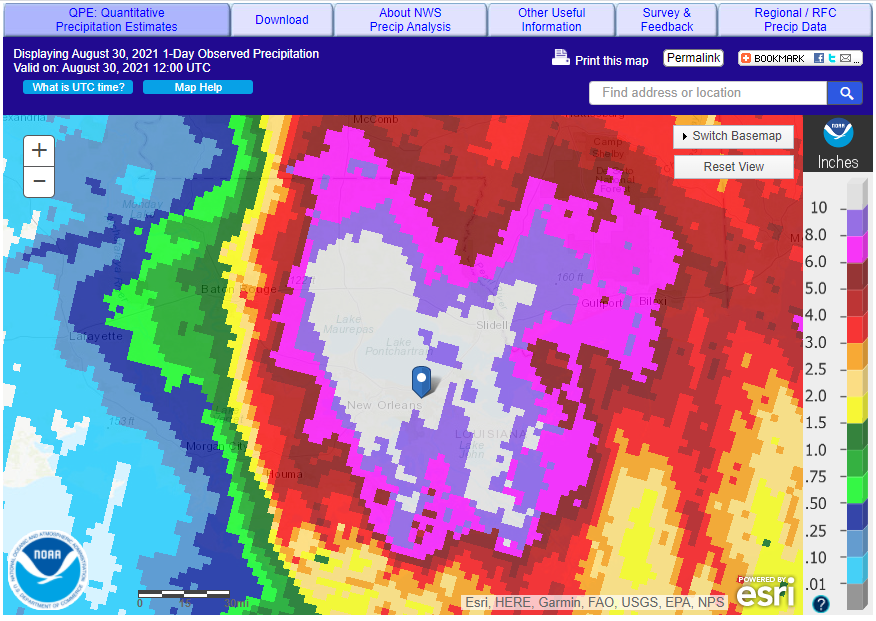
Our best estimations from radar show that there were 10+” of rainfall or greater in the area around New Orleans and the airport. So our reading of this is that the upper limit of rainfall was between 10″-11″ according to radar estimations. This again highlights some of the differences in standard station observational readings and radar. We clearly have stations in this 10+” area and none reported those large totals.
After some searching online we found the source through a link to a Twitter post by a forecast branch chief at NOAA who was looking at radar estimates in real time.
Estimated rainfall of ~17 inches in 20 hours just west of NOLA. #idahurricane #Ida pic.twitter.com/8wxGNr1zUD
— Greg Carbin ☮️ (@GCarbin) August 30, 2021
If you watch the animated GIF closely you can see an area of pink pop up near the area of Lake Maurepas. Finally we have found the radar estimate that was driving all of the reports! The nearest station to this area is LA-TG-10: Ponchatoula which reported almost 12″. The nearest official ISD stations which are slightly further away reported about 5.5″ as an average around that area which is about 10 miles from these reported areas of extreme rain. For this extreme example we cannot ground truth at all since none of the stations are directly under the 17″ area.
Ida’s Destructive Path of Flooding
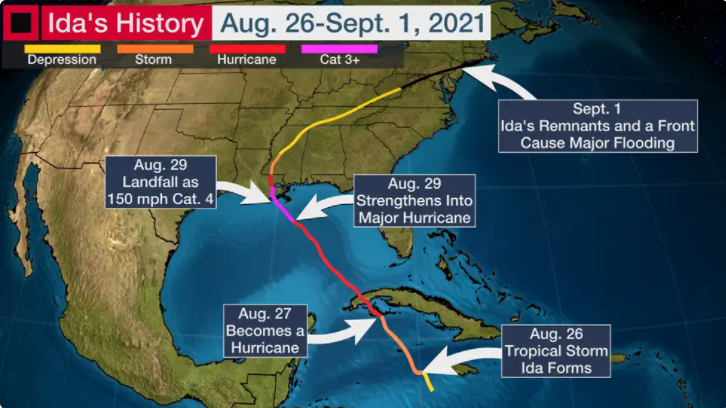
Many people think about hurricanes making landfall, dropping a lot of rain and then slowly tapering off as it loses its source of power and moisture. Often times this can be true. But as we see in the reporting below, Ida started strong and as it reached the northeast US states it ran into another front which created massive storms and precipitation events. Only a few states in the middle of her path were spared from massive flooding.
Here is the path of Ida provided by The Weather Channel:
Using station observational data here are a few of the key cities that were overwhelmed by the moisture brought by Ida and another weather front in the Northeast.
The devastation in these cities occurred with 4-7″ inches of rain with much higher totals in some isolated areas.
Conclusion
Was there 17″ of rain somewhere in the New Orleans area? Quite possibly according to a radar estimate. But what this highlights is that rain and weather in general can be micro-geographic at times. So much so that station data doesn’t even record it. It also highlights some of the continued differences between radar and observational records and the need to continually improve this process.
Should a 17″ radar-reported rain event in a small area of Louisiana be the main headline for how much rain Ida dumped on the area? Probably not. Certainly an interesting fact for a very specific area… and a very impressive amount of rain. Think of it as an Olympic Record and not the norm for the area. However, rain totals of only 1/4 that amount in a short period of time will cause massive flooding in most areas of the United States. We can’t stop media from running with a new Olympic record for rain but just remember that these reports don’t give a good general picture of what is happening across the whole area.
Science or Exaggeration? Perhaps some unconfirmed science with a hyper focus on the extremes.