

In this article we will describe how to use add the weather forecast to your web page.
If you want to quickly add the weather forecast to your website with minimal code, then our free widget will give your website a weather forecast with almost no coding at all. If you are looking for a more detailed explanation, we expand on the simple widget installation steps so you can add weather data to any web page.
Use WordPress? Our new WordPress plugin is the easiest way to add weather to your WordPress site.
Quickly adding the weather forecast to your web page using our weather widget
If you want to add the weather forecast to your website with minimal coding and work, then our free weather widget makes it easy.
Step 1 – Sign up for your own free API Key
You will need a free API key to use this widget. To sign up, visit our Weather Data Services Page. Once you have signed up, it the ‘Account’ button in the top right and copy the API key.
Step 2 – copy the HTML code to display the weather forecast
Copy the following code on to your web page where you would like the weather forecast to appear. Copy your API key from step 1 and replace the ‘YOUR_API_KEY’ text.
<!-- the DIV that will contain the widget -->
<div class="weatherWidget" ></div>

<script>
   window.weatherWidgetConfig =  window.weatherWidgetConfig || [];
   window.weatherWidgetConfig.push({
       selector:".weatherWidget",
       apiKey:"YOUR_API_KEY", //Sign up for your personal key
       location:"London, UK", //Enter an address
       unitGroup:"metric", //"us" or "metric"
       forecastDays:5, //how many days forecast to show
       title:"London,UK", //optional title to show in the
       showTitle:true,
       showConditions:true
   });

   (function() {
   var d = document, s = d.createElement('script');
   s.src = 'https://www.visualcrossing.com/widgets/forecast-simple/weather-forecast-widget-simple.js';
   s.setAttribute('data-timestamp', +new Date());
   (d.head || d.body).appendChild(s);
   })();
</script>
Step 3- Change the location or units
If you don’t make any configuration changes, the widget will used degrees Fahrenheit, inches and miles for the display. If you would like metric units (e.g. Celcius, mm and kilometers), then change the unitGroup setting from “us” to “metric”.
Also if you would like the widget to change from automatically detecting the user location, add a location address in the location setting. For example location:”London,UK”.
Note that the double quotes (“) are important when setting the above settings!
Step 3 -refresh your web page and view the results
That’s all you need to do to get the widget up and running. Simply save the web page file, refresh the web page in the browser and you should see the results!
Want to learn more how the weather API is used to build widgets like this? Continue on reading below.
Using a weather API to add weather data to your web page
The above example places a weather forecast widget on a web page with almost no coding required. We will now expand on how a widget like this is built so you can build your own!
If you would like to add weather data to your web site using backend technologies, check out our articles on PHP and Java.
Technologies – Weather API, HTML, CSS and JavaScript
We want the focus of the example to using and interpreting the weather forecast data from a Weather API so we want to use the minimum of other web technologies. This can then serve as a starting point for you to create a more complete weather forecast display.
We will use JavaScript, HTML and CSS technologies to display the forecast within the page. To keep the JavaScript short and simple, we will use a commonly used library called jQuery to help retrieve the data and format the HTML. There is no need to use the jQuery library – it just helps keeps the code shorter and more readable in this case.
Retrieving the weather forecast data using a weather API
We have recently expanded our weather APIs to include our new Timeline Weather API. This offers seamless data from historical observations, weather forecast and future statistical forecasts. For information, see the Timeline Weather API documentation.
Before we can start creating the web page, we need to find a way to retrieve the weather forecast data. Typically, services such as this are hosted in a cloud as they handle a vast amount of weather data including the forecast plus historical records that can go back many years for 1000s of weather stations.
To allow for easy retrieval of the data, a weather API is built to allow programs, such as the web page we are building, to easily retrieve the data. For a web page, we want a Weather API that allows us to retrieve data using a web based connection.
We will be using the Visual Crossing Weather API. The API allows retrieval of weather forecast data as well as historical weather records and it has been designed with web based applications and web pages in mind.
The Visual Crossing Weather API includes an easy way to build weather API queries via the Weather Data Services Page. On this page we can create a query for the weather forecast, historical weather observations and also historical climate summaries.
We can also view the results in the browser and even download them to an spreadsheet, so we can make sure that the weather data fits our requirements.The process to create a query for a location is simple:
1. Open the Weather Data Query page
2. Create a free trial account if necessary and log in. The tool offers a free trial including API access.
3. Add a single location using the location address or latitude,longitude co-ordinates. The tool supports adding multiple locations and even importing the locations from a spreadsheet or other file. In our simple case we’re choosing a single location that we will associate with the weather forecast viewer that we are building.
4. Build the weather data definition. In this case we will use the default, daily forecast request. We could also have built a request to retrieve weather data for multiple locations or to retrieve historical weather data.
5. View the data in the browser. We can view the data directly in the browser so that we can understand the data we will be receiving from the API.
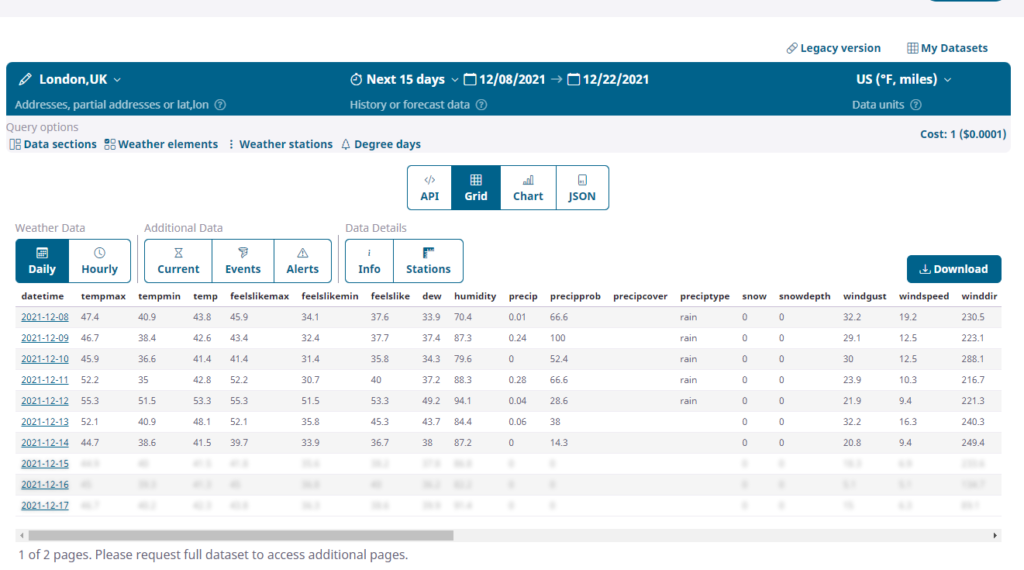
6. Create the Weather API request. Finally, we use the forecast definition we created for viewing the data in browser to create a Weather API request to retrieve the data ourselves. The API supports many types of additional parameters to suit various needs. The only thing we will change is the output format from CSV to JSON. JSON format will make it easier to process via JavaScript.
More information can be found on the Weather Data & Weather API through the weather data documentation.
The Weather API query results
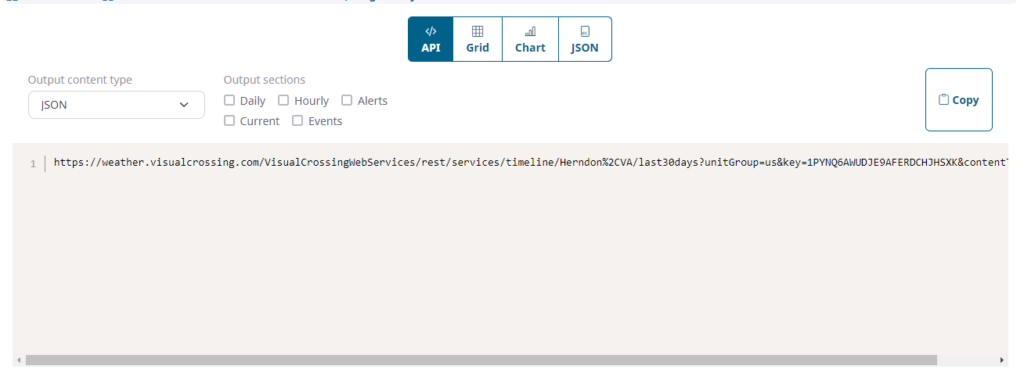
Here is the query that we have constructed using the query builder page:
https://weather.visualcrossing.com/VisualCrossingWebServices/rest/services/timeline/London%2CUK?unitGroup=us&key=YOUR_API_KEY&contentType=json
In our simple case we will only need to modify a couple of the parameters through the code when the forecast display is populated:
location – the location parameter specifies the address of the location for which we would like the weather forecast. We will replace this with the user selection via a parameter in the HTML.
unitGroup – the unitGroup tells the API what units to return weather data in – US or metric.
key – This is the API key that is used by the Weather API to uniquely identify your account.
For more information on the weather API queries, see the Weather API documentation
The Weather API query results
You can see the result of the query by pasting the URL into a browser. To help with readability, we have used the browser Network log Preview feature to format the JSON.
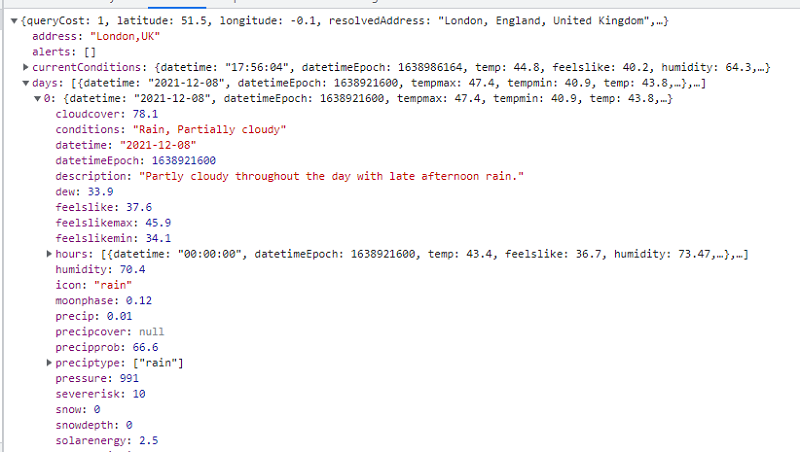
The Weather Forecast response is a JSON structure. The weather data is found under the ‘location’ property.
The location value includes an array of values plus some other general information – some of which is not used for weather forecast data. The value array represents the weather forecast time periods. There are 15-16 elements representing the 15-16 calendar days in the weather forecast.
The variable number of days in the forecast are a result of how the weather forecast hours split across calendar days. For example, if the ’15-day’ forecast starts at 6pm, then it will cross over 16 calendar dates (15-day refers to a 15*24 hours period, not 15 calendar days). We will need to write code that can handle a variable number of possible forecast days.
Each day within the forecast has a series of weather elements representing the forecast for that day. In this case we can see that we have requested data in US units so the high temperature (maxt) is predicted to be 45F and low temperature (mint) is predicted to be 40F.
We are going to be creating HTML from each of these days and extracting the weather elements to show in our forecast and creating HTML elements to contain the data.
For more information on the weather data format and available variables, see the weather data documentation
Adding the Weather Forecast to Web Page
We will now build the weather forecast display.
Weather forecast HTML container
We will start by using a simple DIV element as the placeholder for the Weather Forecast.
<div class="verticalweatherForecast" data-key="YOUR_API_KEY" data-location="London, UK" data-unitGroup="metric">/>
This HTML element defines the location of the weather forecast content within the HTML page. The HTML element also provides some of the parameters needed by the forecast display by using custom attribute prefixed with ‘data-‘. These parameters are the API key, the location and the unit group to use to display the data. The class, ‘verticalweatherForecast’ is web page’s style information indicate the container size, style etc.
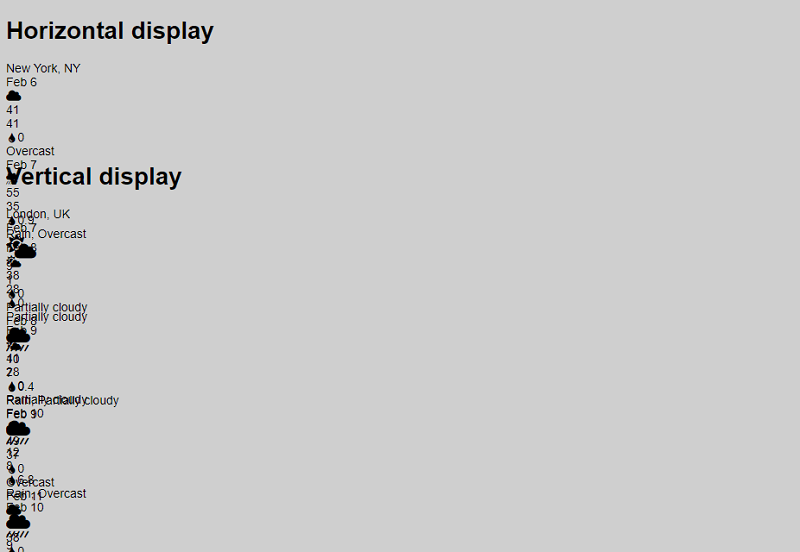
In this simple example, we are going to rely on the container styling rules to govern what size to display our weather forecast. From this information, we will choose a horizontal or vertical display and apply some simple styling to create a weather forecast. If size of the container element changes after the initial rendering we will rely on the existing HTML and CSS rules to display the content – we won’t re-execute the refresh code and re-render to reflect a different orientation. This is en exercise that can be left to the reader!
Attaching and initializing the container
We are ready to write some Javacript to retrieve the weather data using the request we created above. We can then use this data to populate the forecast element. A simple JavaScript class called ‘WeatherForecastWidget’ will handle the weather forecast data retrieval and display. There will be one instance of WeatherForecastWidget for every weather forecast widget on the page. In our test page we are going to have two forecast displays so we will have two instances of the class. Here is the skeleton structure of the class:
	function WeatherForecastWidget(selector) {

            //Initialize the widget using the container parameters
            this.config={
                "location":selector.attr("data-location"),
                "unitGroup":selector.attr("data-unitGroup") || "us",
                "key": selector.attr("data-key")
            }


            //the root HTML tag selector
            this.selector=selector;

            //weather forecasta data
            this.data=null;

            var me=this;
            //constructs Weather API request and then loads the weather forecast data from the Weather API
            this.loadForecastData=function() {
               ...
            }

            //displays the weather data inside the container tag
            this.refresh=function() {
               ...
            }
        }
When we execute the ‘attach’ bootstrap code, we’ll pass the jQuery selector of the forecast widget container element. The forecast widget class extracts the location, unitGroup and api key from custom attributes on the forecast container HTML tag. The class then has two skeleton methods which we will populate. The first method, ‘loadForecastData’, loads the Weather Data from the Weather API. The second, ‘refresh’, refreshes the forecast display.
The following code is used to attach the HTML to the widget and create the WeatherForecastWidget instance.
	var attach=function(selector) {
        var instance=new WeatherForecastWidget($(selector) );
        instance.loadForecastData();
        return instance;
    }
We call this attach method once for each of our two forecasts. The attach code must be executed after the page has loaded and so we place this attach code at the bottom of the html page:
     WeatherForecastDisplay.attach(".horizontalweatherForecast");
     WeatherForecastDisplay.attach(".verticalweatherForecast");
There are other ways to initialize the control. For example the JavaScript code could find appropriate container divs using as a CSS selector searches. Notice that the above attach method does return the newly created WeatherForecastWidget instance which we could use in the future to attach event handlers for interactivity etc.
Loading the Weather Forecast Data
Let’s now look at the loadForecastData method which loads the Weather Forecast data:
     //constructs Weather API request and then loads the weather forecast data from the Weather API
     this.loadForecastData=function() {
         //endpoint
         var uri="https://weather.visualcrossing.com/VisualCrossingWebServices/rest/services/weatherdata/forecast?";
         //parameters
         uri+="unitGroup="+me.config.unitGroup+"&locationMode=single&aggregateHours=24&contentType=json&iconSet=icons1&location="+me.config.location+"&key="+me.config.key;
         $.get(uri, function( rawResult ) {
            me.data=rawResult;
            me.refresh();
         });
     }
We can see that the method is quite simple. The method first constructs the URI based upon the unitGroup, location and key parameters and then submits it to the jQuery get method to retrieve the return value.
When the request completes, the code populates the data property of the WeatherForecastWidget instance in the callback of the get method. Finally the callback calls the ‘refresh’ method to refresh the display. To keep things clean we have not added a lot of network error handling code.
We would recommending adding additional code for production deployment. This code should ensure a failure to connect or retrieve data is handled gracefully.
Displaying the Weather Forecast Data
We now should have the weather forecast ready to display in the HTML Container. This display is performed through the refresh method.
We have split the method up into smaller chunks for this walk through. The first section of the refresh method sets up the selectors, extracts the forecast data and exits cleanly if a bad or missing data situation occurs.
        //'me' refers to the WeatherForecastWidget instance
        var root=$(me.selector);
        //no data at all - exit
        if (!me.data) {
            $(me.selector).html("No data available for "+me.config.location);
            return;
        }
        //no locations in the data -  exit
        var locationData=me.data.location;

        var forecastValues=locationData.values;
We now are ready to populate the HTML. First we create a basic HTML structure of a div element for the location label and container for the days. The ‘days’ element will contain another div element for every day of the weather forecast.
        //add a root style for CSS specificity and top level rules
        root.toggleClass("forecastwidget", true);
        //construct the HTML skeleton
        root.html("<div class='location'></div>"+
                "<div class='days'></div>"+
                "<div class='footer'><a href='https://www.visualcrossing.com/weather-api' title='Weather Data by Visual Crossing' target='_blank'>Credit</a>");
Before we can populate the days, we need to decide whether to display the days horizontally or vertically. We are going to keep things very simple – if the container is wider than it is tall, then we assume horizontal display. If it is taller than it is wide then we will use vertical display. We will use an additional CSS class to switch the format of the days when the display is vertical. If there is not enough room to hold all the days of weather forecast we will use the CSS to hide the extra content.
        //use the container size to decide how to display the forecast
        //and how many days
        var rect=root.get(0).getBoundingClientRect()
        var isVertical=rect.height>rect.width;
        root.children(".days").toggleClass("vertical", isVertical);
Populating the weather forecast day
Each day of the forecast is a set of HTML elements that correspond to a variable of the weather forecast. We are going to show five pieces of information for each day – the date, an icon which summarizes the conditions, the maximum and minimum temperatures, the expected rainfall and a little text summary of the conditions.
        <div class='day'>
           <div class='date'></div>
           <div class='icon' ></div>
           <div class='maxt'></div>
           <div class='mint'></div>
           <div class='precip'<span class='value'></span></div>
           <div class='conditions'></div>
        </div>
To create and populate the above HTML, we iterate the forecast values (which represent each day of the forecast). We add a new HTML structure for each day which looks like this:
        <div class='day'>
           <div class='date'></div>
           <i class='icon fas' ></i>
           <div class='maxt'></div>
           <div class='mint'></div>
           <div class='precip'><span class='value'></span></div>
           <div class='conditions'></div>
        </div>
For temperature, location name and conditions, we can insert the weather forecast variable value directly into the appropriate div for the day with the minimum of formatting. In this case we rounded the values to remove unnecessary decimal points. Later we will discuss how the unit of measurement for each value could be added. The date, precipitation (rainfall) and conditions icon are a little more involved.
The ‘datetime’ of the forecast period is returned as the number of milliseconds since the JavaScript epoch but using the local time of the location requested. As JavaScript automatically adjusts this for the browser timezone, it’s necessary to remove the offset that JavaScript adds. We then format the date to produce a Month-Date value.
In the query, we requested that the result include icon codes for each weather forecast period. We use this value to select an appropriate icon using a CSS selector
forecastValues.forEach(function(d) {
        //create a new day div with children
        var dayElement=$("<div class='day'>"+
                "<div class='date'></div>"+
                " <div class='icon' ></div>"+
                "<div class='maxt'></div>"+
                "<div class='mint'></div>"+
                "<div class='precip'><span class='value'></span></div>"+
                "<div class='conditions'></div>"+
                "</div>");

        //add the day to the days element
        root.find(".days").append(dayElement);


        //temperature and conditions are simply inserted into the appropriate div
        dayElement.find(".maxt").html(Math.round(d.maxt));
        dayElement.find(".mint").html(Math.round(d.mint));
        dayElement.find(".conditions").html(d.conditions);

        //date is added with a little additional formatting
        var date= new Date(d.datetime);
        //by default the values are returned in the local time zone of the location requested
        date=new Date(date.getTime()+ date.getTimezoneOffset()*60000);
        dayElement.find(".date").html(MONTHS[date.getMonth()]+" "+date.getDate());


        //the rainfall value includes so hide the whole section if no rainfall
        var precip=dayElement.find(".precip");
        precip.toggleClass("hidden",  !d.precip);
        precip.find(".value").html(d.precip);

        //a simple logic decides which icon to show based upon the conditions
        var icon=dayElement.find(".icon");
        icon.toggleClass(d.icon,true);
});
Formatting the forecast
If you run the page now, the weather forecast should be populated however it looks awful! We need to add some CSS to format it correctly. The first step is to arrange the days horizontally or vertically depending on the view we decided earlier. If you recall, we added the additional ‘vertical’ CSS class if the display should be vertical. This will allow us to add CSS rules that are conditional on the orientation.
Three CSS selectors define the basic layout. The .forecastwidget rule itself defines that the location, days and footer should be displayed vertically. The .days class indicates that should be displayed using flex layout. When this is displayed in horizontal view, we use row-based flex layout and when it is displayed using the vertical view, we use column-based flex layout
        .forecastwidget {
            display: flex;
            flex-direction: column;
            padding: 5px;
            font-size: 14px;
            background-color:#ffffff;
            margin:10px;
            border-radius: 7px;
        }
        //basic days rules - used for both horizontal and vertical layout
        .forecastwidget .days {
            display: flex;
            flex-direction: row;
            justify-content: start;
            flex: 1;
            overflow: hidden;
        }
        //vertical layout overrides the orientation of the days
        .forecastwidget .days.vertical {
            flex-direction: column;
            font-size: 1.2em;
        }
Switching the order from horizontal to vertical is not enough to make an attractive forecast however. We need to arrange the content within the day a little differently based on the view. We will use CSS Grid Layout to arrange the day content (sorry older browsers!).
For the horizontal view, the weather forecast elements are arranged vertically. We do this by specifying a grid layout with two columns. Most of the weather elements span both of these columns but the Maximum and minimum elements span one – left and right.
        //define a grid layout with two columns
        .forecastwidget .days .day {
            display: grid;
            grid-template-columns: 50% 50%;

            justify-content: center;
            align-items: center;
            padding: 0px 5px;
            font-size: 0.9em;
            justify-items: center;
            grid-gap: 1px;
        }

        //most forecast elements take up two columns
        .forecastwidget .days .day * {
            grid-column: span 2;
            display: flex;
            align-items: center;
            justify-content: center;
        }
        //maximum and minimum elements are arrange side by side
        .forecastwidget .days .day .maxt {
            grid-column: 1 ;
        }
        .forecastwidget .days .day .mint {
            grid-column: 2 ;
        }
For the horizontal view, the weather forecast elements are arranged vertically. We do this by specifying a grid layout with two columns. Most of the weather elements span both of these columns but the Maximum and minimum temperature elements span one – left and right.
       /*define a grid layout with two columns*/
        .forecastwidget .days .day {
            display: grid;
            grid-template-columns: 50% 50%;

            justify-content: center;
            align-items: center;
            padding: 0px 5px;
            font-size: 0.9em;
            justify-items: center;
            grid-gap: 1px;
        }

        /*most forecast elements take up two columns*/
        .forecastwidget .days .day * {
            grid-column: span 2;
            display: flex;
            align-items: center;
            justify-content: center;
        }
        /*maximum and minimum elements are arrange side by side*/
        .forecastwidget .days .day .maxt {
            grid-column: 1 ;
        }
        .forecastwidget .days .day .mint {
            grid-column: 2 ;
        }
We now override this for our vertical view. The vertical view uses a horizontal display for each day. This horizontal view is a single row of cells so all of the elements use a single span cell. We add CSS rules to override the day arrangement when the forecast is displayed in vertical mode:
        /*define a grid layout with size columns*/
        .forecastwidget .days.vertical .day {
            grid-template-columns: 50px 30px 30px 30px 60px auto;
            grid-gap: 4px;
            justify-content: start;
            margin: 2px 0px;
            padding: 4px 0px;
        }
        /*Every element takes up a single grid cell*/
        .forecastwidget .days.vertical .day * {
            grid-column: span 1;
        }
         /*No special layout is required for the temperature values*/
        .forecastwidget .days.vertical .day .maxt,  .forecastwidget .days.vertical .day .mint  {
            grid-column: default ;
        }
We should now have a relatively attractive weather forecast layout. The final thing we do is add a little bit of formatting to the elements.
        /*element styling rules*/
        .forecastwidget .location {
            font-size: 1em;
            font-weight: bold;
            flex:0;
        }
        .forecastwidget .footer {
            font-size: 0.7em;
            color:darkgrey;
            display: flex;
            justify-content: flex-end;
        }
        .forecastwidget .days .day .date {
            color:darkgrey;
            font-size: 0.9em;
            white-space: nowrap;
        }


        .forecastwidget .days .day:not(:last-child) {
            border-right:1px solid darkgray;
        }

        .forecastwidget .days.vertical .day:not(:last-child) {
            border-right:none;
            border-bottom:1px solid darkgray;
        }

        .forecastwidget .days .day .conditions {
            display:none;
            color:darkgrey;
            font-size: 0.9em;
        }
        .forecastwidget .days.vertical .day .conditions {
            display:block;
        }
        .forecastwidget .days .day  .maxt {
            font-weight: bold;
        }
        .forecastwidget .days .day  .mint {
            font-size: 0.9em;
            color:darkgrey;
        }

        .forecastwidget .days .day  .hidden {
           visibility: hidden;
        }
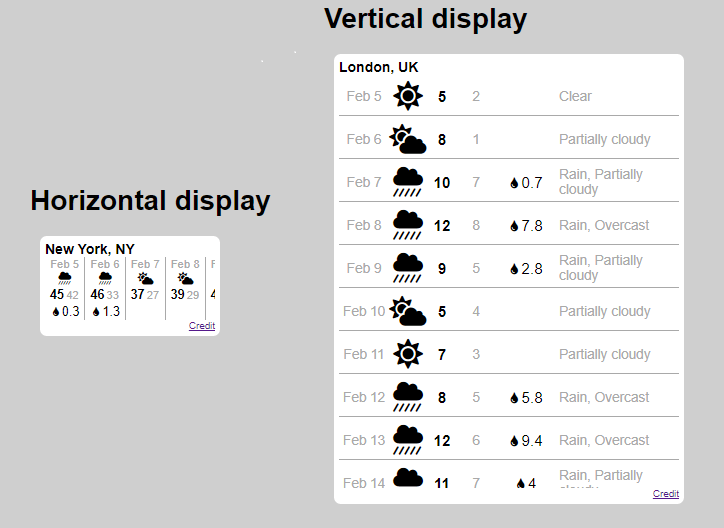
Our final Weather Forecast Display – where next?
We now have our basic Weather Forecast display wired and displayed. The forecast will refresh whenever the page is reloaded. Depending on the formatting of the container element, the widget will switch from a horizontal to vertical view. We have seen that this project is quite straightforward if you are familiar with HTML, CSS and JavaScript. After learning how to build the weather API query, the results can be retrieved in JSON format and immediately used to create an HTML weather forecast.
You can find the full code for this sample in the Github.
There are some missing features that would be nice to add. Firstly we don’t display the units of measurements on the temperature or rainfall values. It’s easy to find out what unit a particular weather value should be formatted in. In the Weather Forecast JSON, the weather element definitions can be found in the ‘columns’ object that is returned along with the locations. The columns object is a map of all the available columns that are used in the data. Each variable contains two very useful values – the variable full name and also the unit of measurement used for the value.
Another feature that would be nice to add would be some more interactivity – for example if forecast days are hidden, add a way for the user to open the hidden days or maybe click on a day to retrieve the hourly forecast?
Finally, it would be great if we could take advantage of some of the more advanced features of the weather API. How about creating an infinite weather forecast that switches to use historical climate statistics to predict the weather more than 15 days out? Alternatively we could allow users to bring up historical weather data records in a similar forecast-style widget.
Looking for a more complete widget? We have released our open source weather components. You can read more about them and get the source code from GitHub.